
📝 From Azure DevOps to Splunk: Complete Insight into Workitems, MTTR, and Team Progress
July 21, 2025 - by Tom de Bruijn 4 min read
In many DevOps environments, I see the following pattern: an alert is triggered in a monitoring tool, which either manually or automatically creates a ticket in an incident management system like Azure DevOps or Jira. An engineer investigates the issue, documents the root cause, and eventually resolves and closes the ticket. What’s often missing in this flow: meaningful, connected insight. Tickets and logging may be technically integrated, but in practice they often live in separate silos. This leads to two common problems:
- Lack of direct context: From within a ticket, there’s often too little information available and no direct link to the relevant log data or dashboard. Engineers must manually search for the right logs, a time-consuming and error-prone process.
- Limited visibility into incident flows: Since tickets aren’t visible in Splunk, there’s no overview of how many issues are active, which ones are resolved, or how long they took. That makes it difficult to spot trends, improve processes, of steer effectively.
✅ With a smart integration between ticketing and monitoring software, I solved this. In this blog, I explain how to set this up technically. The implementation is robust, scalable, and easily adaptable to your own data models and similar tools like Jira and other monitoring platforms. This provides:
- 📌 For engineers: direct linking of logs and events to relevant tickets (work items); No context-switch needed.
- 📈 For managers: Steering information – Clear reports on MTTR, MTBF, and lead times; organized, configurable, reliable.
- 👨💻 For teams: Quick context for an error log or alert – linked to the correct ticket, with an overview of all tickets by project, priority, tag, or department.
- 📊 For the whole organization: insight, data-driven improvement opportunities, and fewer surprises.
💡 *In this blog I use Azure DevOps and Splunk as an example, but the same setup can be applied to other tooling.*
🔧 How do you achieve this?
To correctly link Azure DevOps tickets, known as Workitems, to Splunk and generate actionable insights, you need the following components:
• Azure DevOps PAT Token – For REST API calls to Azure DevOps to fetch workitem IDs and metadata.
• Splunk REST Token – Used to check the current workitem status in Splunk via its REST API.
• Splunk HEC Token – For sending new events into Splunk via the HTTP Event Collector.
• Splunk Index + Sourcetype – A dedicated Splunk index and JSON sourcetype to store the enriched workitem data.
• Server for YAML Script – A server or runner where the YAML script runs, with access to both Azure DevOps and Splunk.
🧩 Het YAML script in vijf duidelijke stappen:
Request Azure DevOps API - WIQL
Using the Azure DevOps WIQL API, you can perform queries as the name (Work Item Query Language) suggests. In this API call, I retrieve a list of work item IDs that have been modified in the past 24 hours.
Batch request Workitems metadata
With the Batch request Workitems API, I then request the relevant data fields per work item for the list of IDs.
Query Splunk REST API
Using the Splunk REST API, I check whether the work items are already present in Splunk and determine their current status based on time.
Filter Events in pipeline
At this stage in the pipeline, I have the fetched events from Azure DevOps and from Splunk. By filtering in the code, I match these lists and check where the Azure DevOps value is newer than the one in Splunk, or not yet present in Splunk. This way, only new or updated events are retained.
Send only new events to Splunk via HEC
Send the filtered events in batch via the Splunk HTTP Event Collector.
*💡- Azure DevOps & Splunk have API limit's, therefore i work with batches in the YAML script for processing the records.*
*💡- Need of full sample code, drop me a message, happy to help!*
📊 Splunk Dashboard:
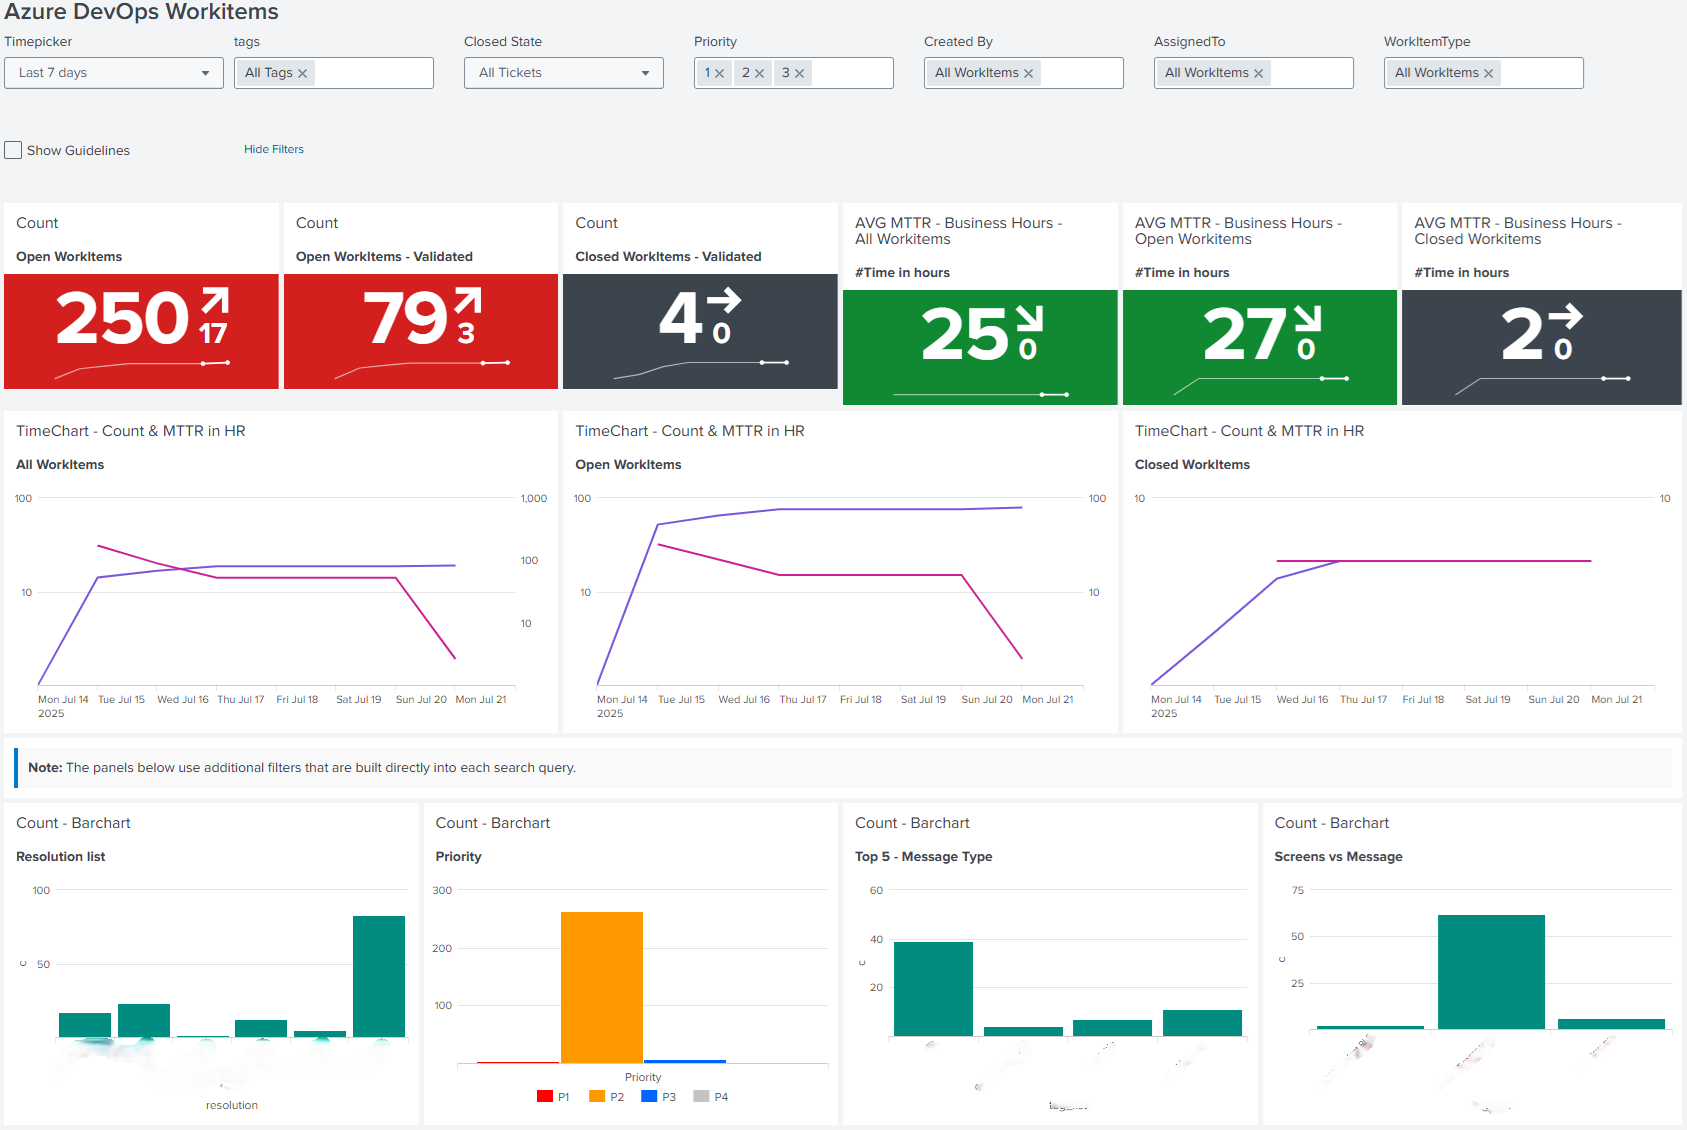
The end result is a dynamic Splunk dashboard that visualizes the workitem data. Key components:
• One base search – A single search powers the entire dashboard. All panels use this shared search, avoiding redundant queries and improving performance.
• Time filtering – working hours, MTTR, MTBF – MTTR (Mean Time To Repair) and MTBF (Mean Time Between Failures) are calculated by comparing timestamps, for MTTR, typically the time between “acknowledged” and “resolved”. In Splunk, this can be further refined to count only business hours (e.g., 08:00–17:00), ignoring nights and weekends, and even public holidays.
• Visualizations & filters – Use filters for team, priority, tag, label, status and more. This makes it easy to identify bottlenecks, enforce priority workflows, and monitor trends over time.
📬 In need of some sample code, or want to see this in action? Request a demo!
Reach out via below options or respond to this post on LinkedIn.